Energy Management
Saas - Web UI Design
2024
We aim to develop a brand-new EMS system with a user-centric approach. As a latecomer in a mature industry, we hold ourselves to higher ideals and ambitions, striving to deliver a refreshing and innovative experience for industry users.
How to get started
I conducted user interviews with more than five energy storage companies and over twenty industry professionals. By applying the KJ method for idea and feature categorization, and leveraging feature prioritization, we were able to clearly define the core requirements. During this process, we identified a crucial north star metric: since hardware configurations and specifications vary across different countries and sites, administrators expect to manage all devices visually on the landing page and quickly set key parameters to control the energy system. At the same time, a high degree of customization is essential. With this clear direction, I proceeded to define the following key design features.
-
User Interviews
On-site Field Studies
KJ Method (Affinity Diagramming)
Feature Prioritization
-
We conducted interviews with representatives from over 5 energy storage companies and more than 20 industry professionals.
“ Empowering Enterprises with an Intuitive and High-Performance Energy Management System “
This project aims to create an Energy Management System (EMS) that combines high performance with exceptional usability. By leveraging design thinking, we seek to deliver a clear and intuitive user interface, enabling users to precisely monitor, manage, and optimize their energy usage. Our system will help reduce operational costs while enhancing sustainability. Seamlessly integrating with existing equipment, it offers real-time data analytics and flexible scalability, positioning itself as an indispensable tool for smart energy management in enterprises.


Evaluation Criteria
Differentiated Design Approach
Our EMS distinctly stands apart from most competitors by focusing on ultimate simplicity and a user-centered design philosophy. Every feature is derived from real user scenarios, eliminating unnecessary operations and enabling users to complete energy monitoring and management tasks in the most intuitive way.
Application of UX Methodologies
Throughout the design process, we applied methods such as User Journey Mapping and Feature Prioritization to clearly define core tasks and pain points. These approaches allowed us to prioritize the information architecture, ensuring users can immediately access critical energy data and actions upon entering each function page, thereby enhancing information accessibility and decision-making efficiency.
Highly Customizable and Flexible Editing
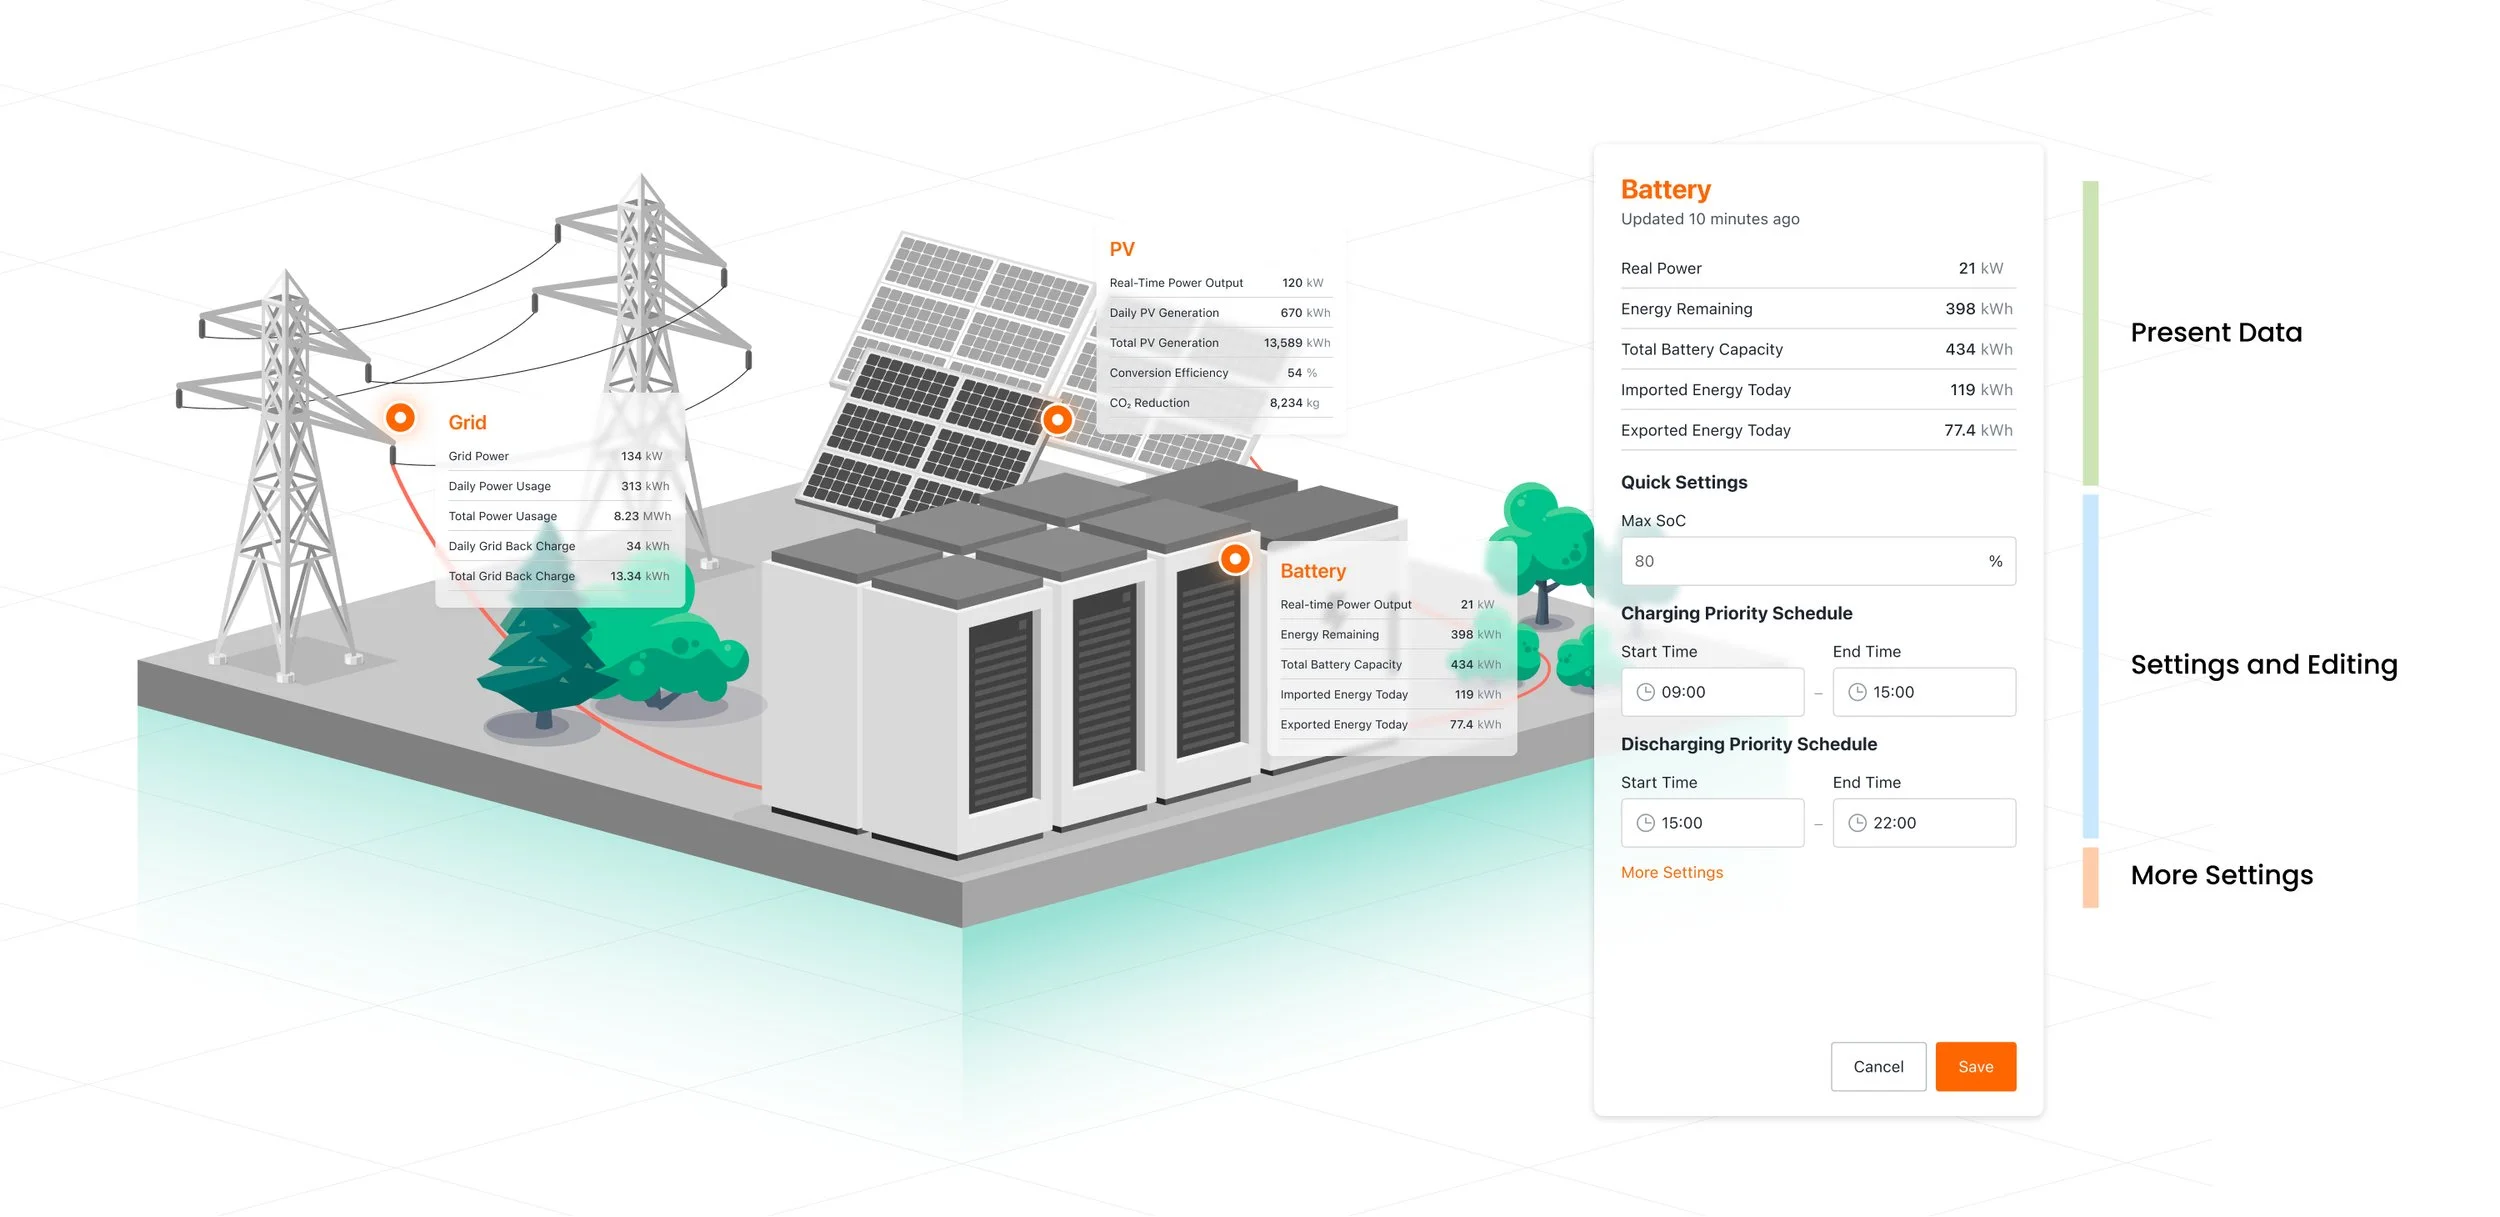
Our system provides highly customizable pages, allowing users to add, modify, or remove hardware devices according to the requirements of different scenarios. All device content can be edited and reorganized directly on the main interface, delivering a true "what you see is what you get" experience and significantly improving the flexibility and efficiency of energy management.

Problem
“When administrators add or remove devices, they need to manually switch to the hardware management section through the menu, constantly toggling between different functions. Additionally, the data presented on the portal is mostly in a traditional dashboard format, making it difficult to efficiently interpret key information.”
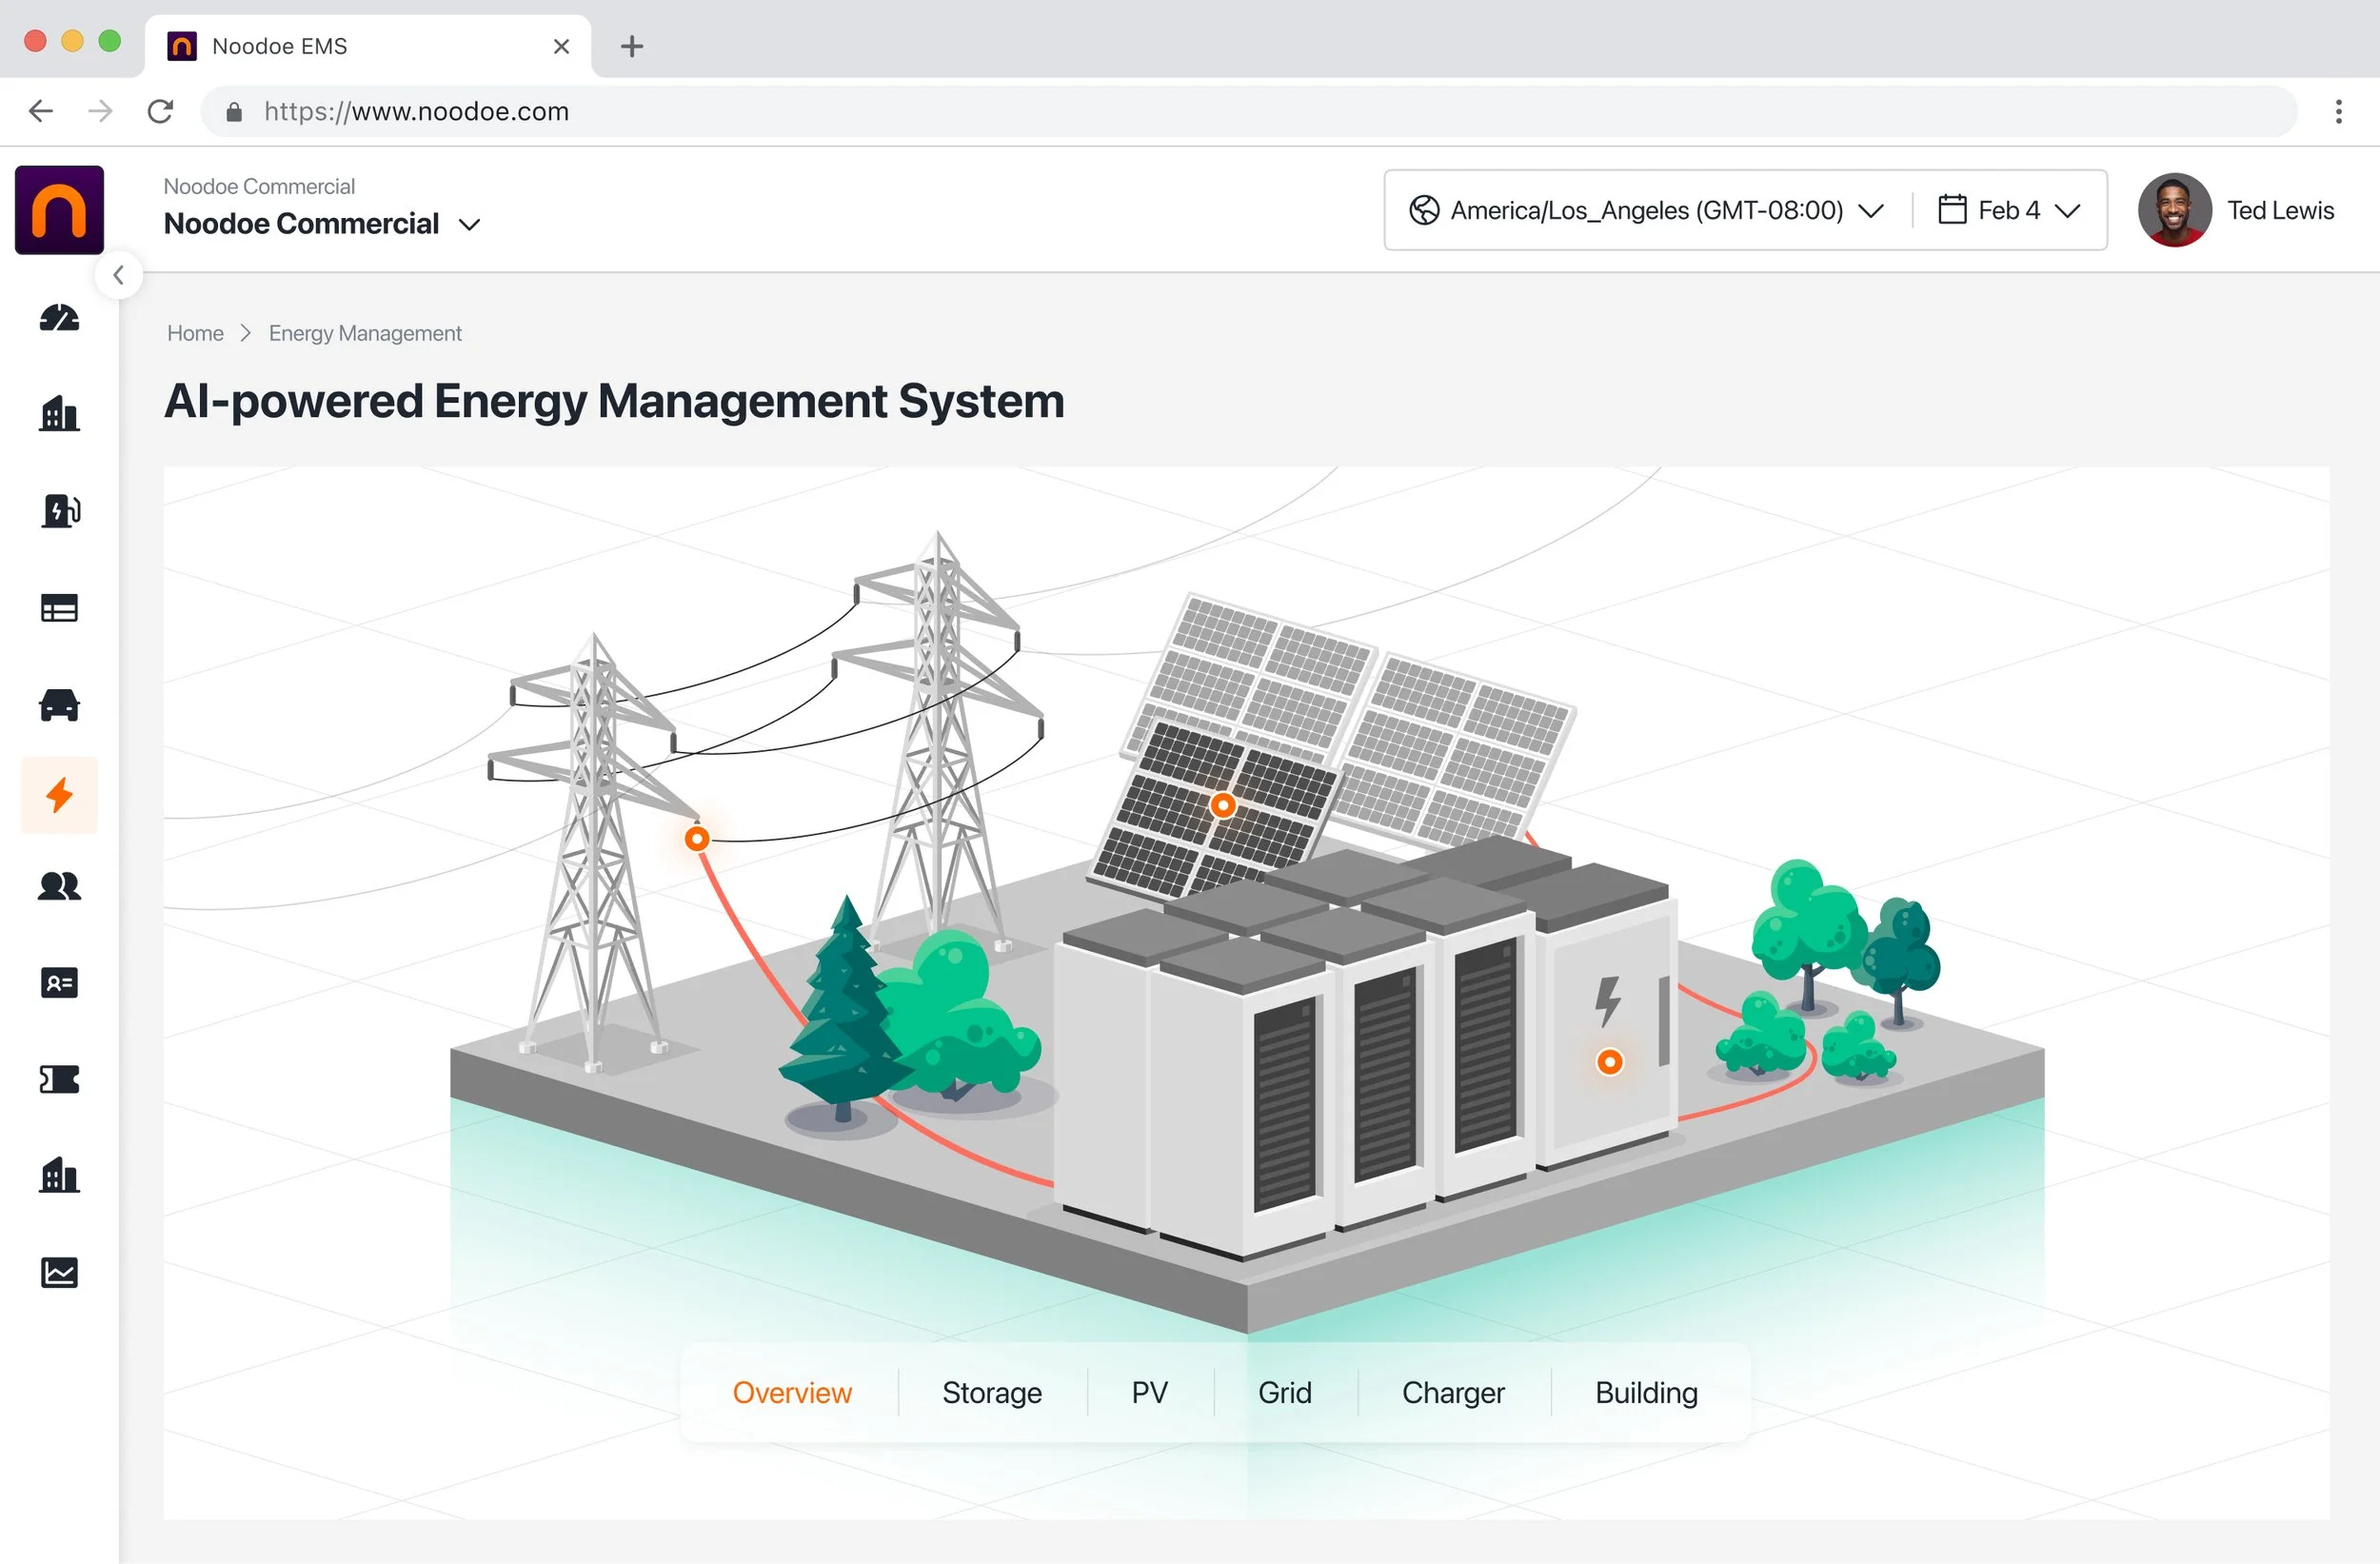
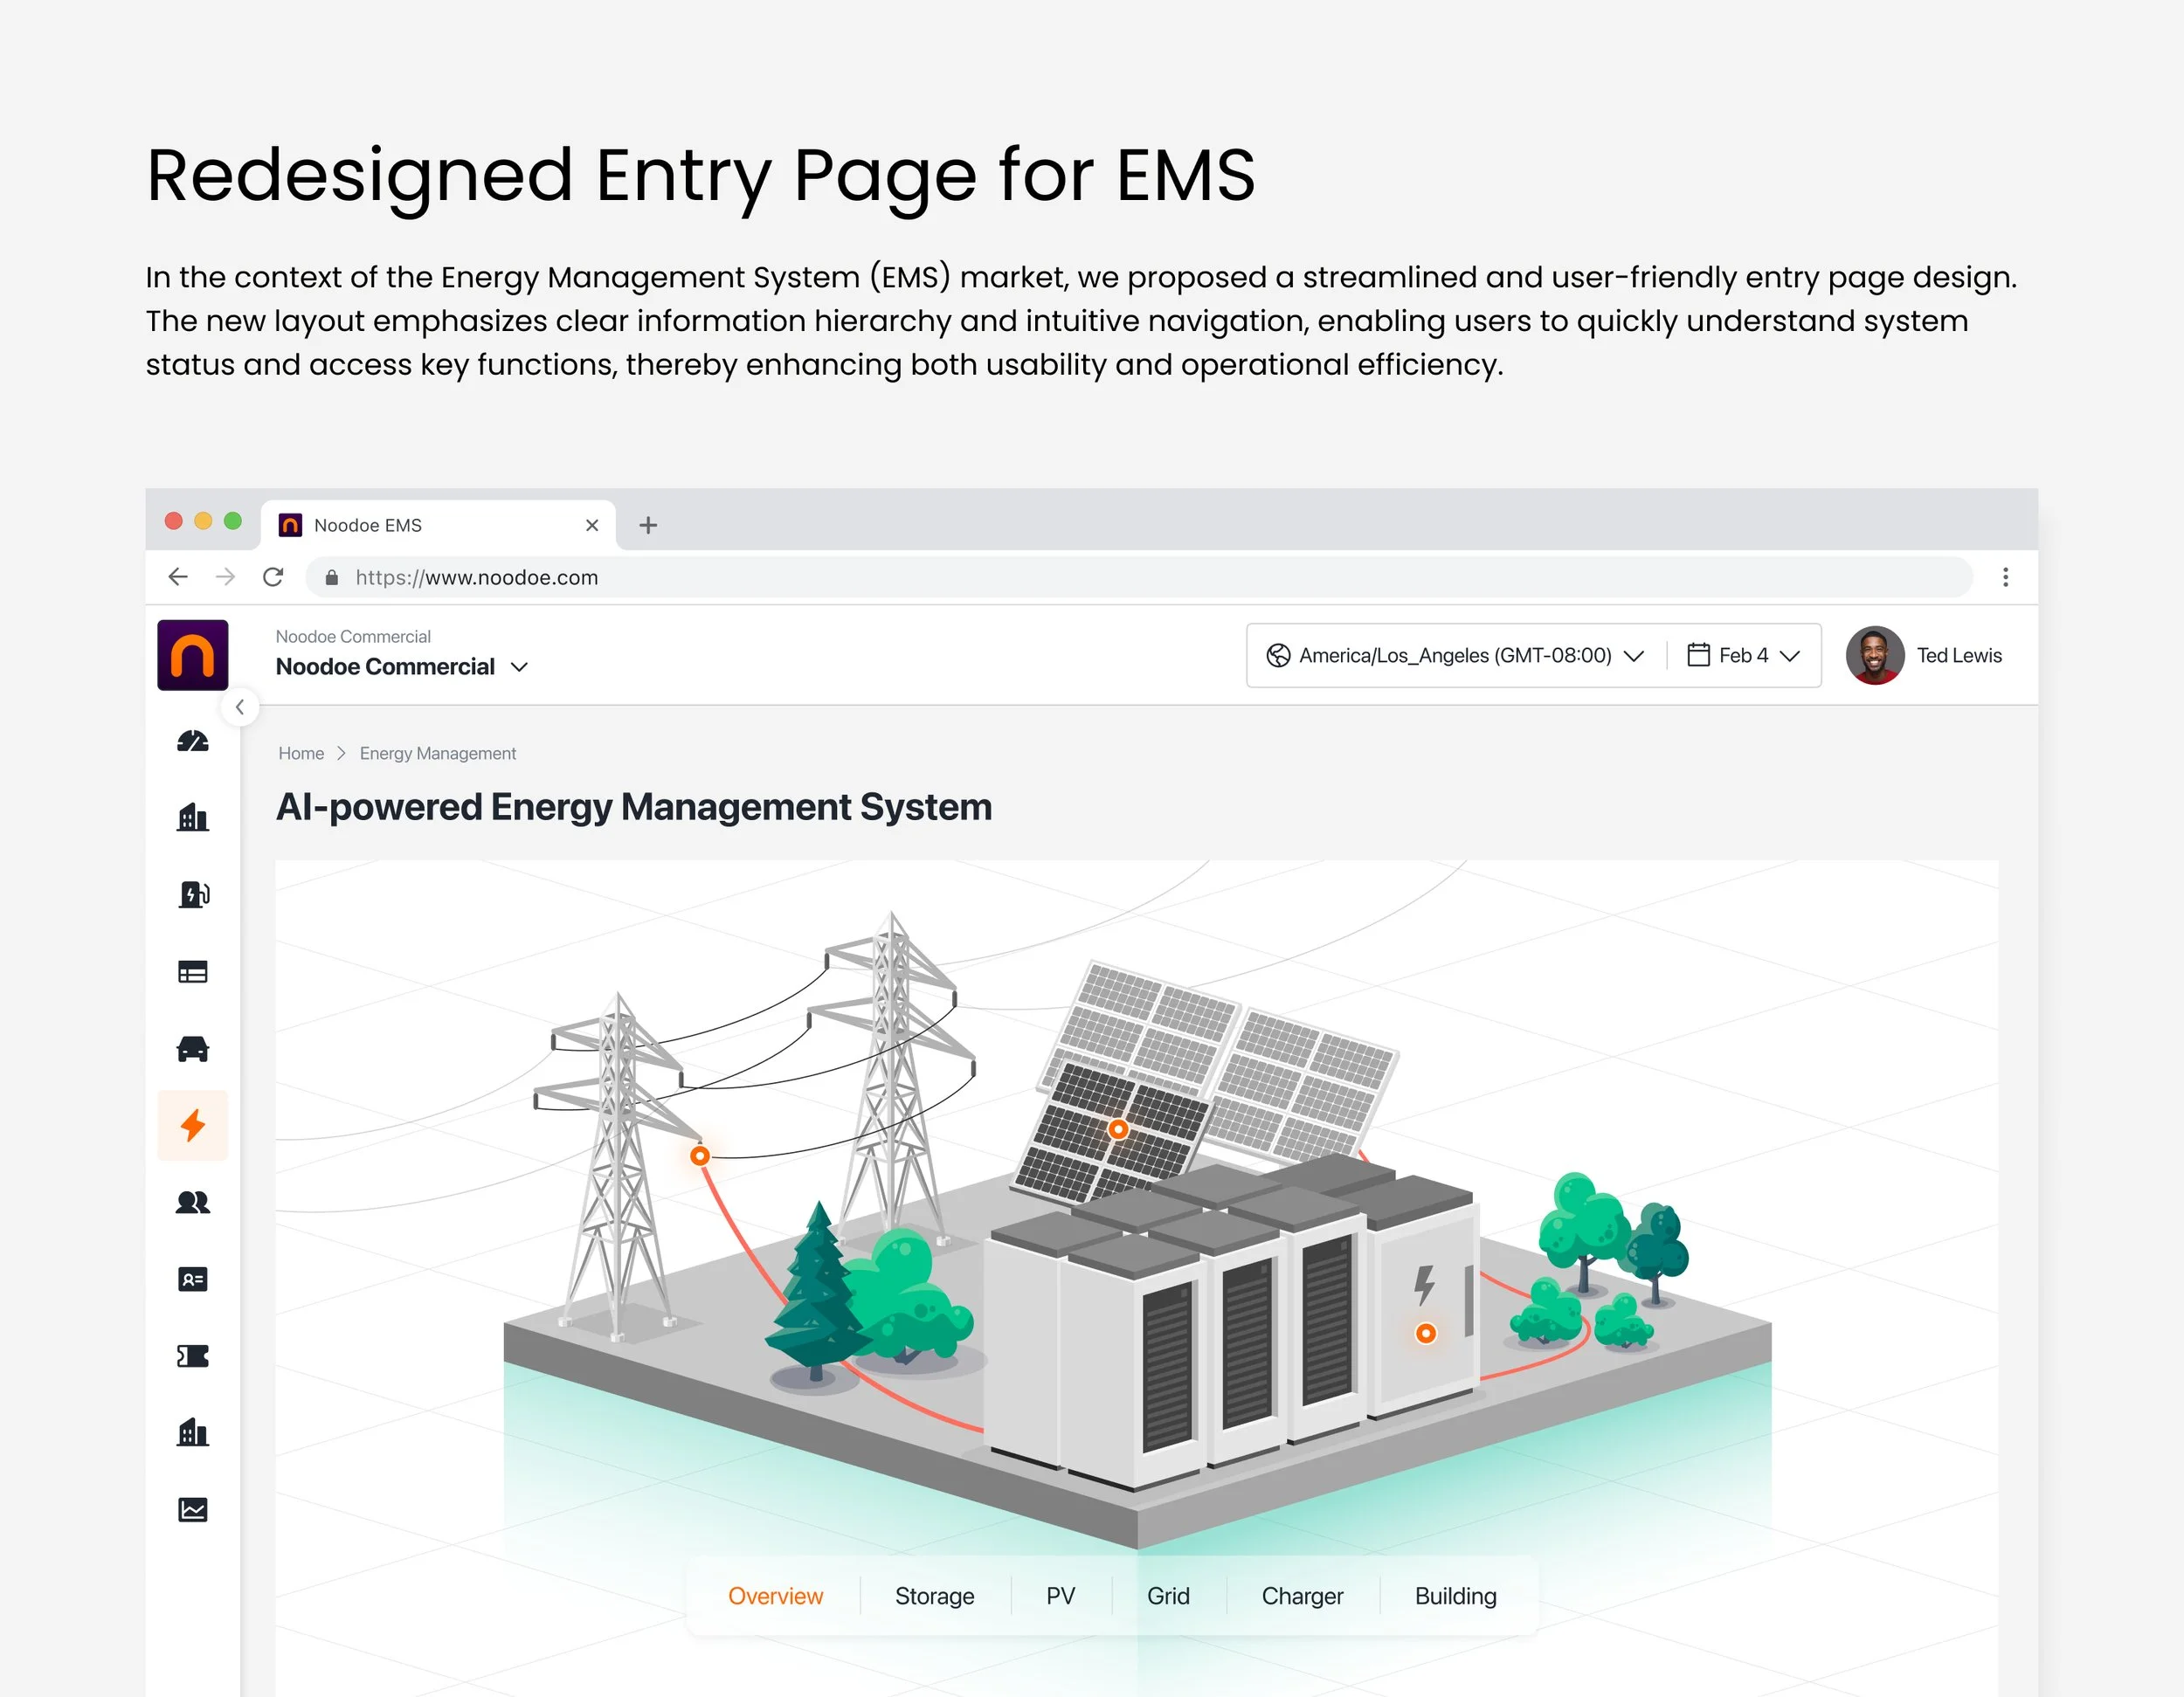
Solution
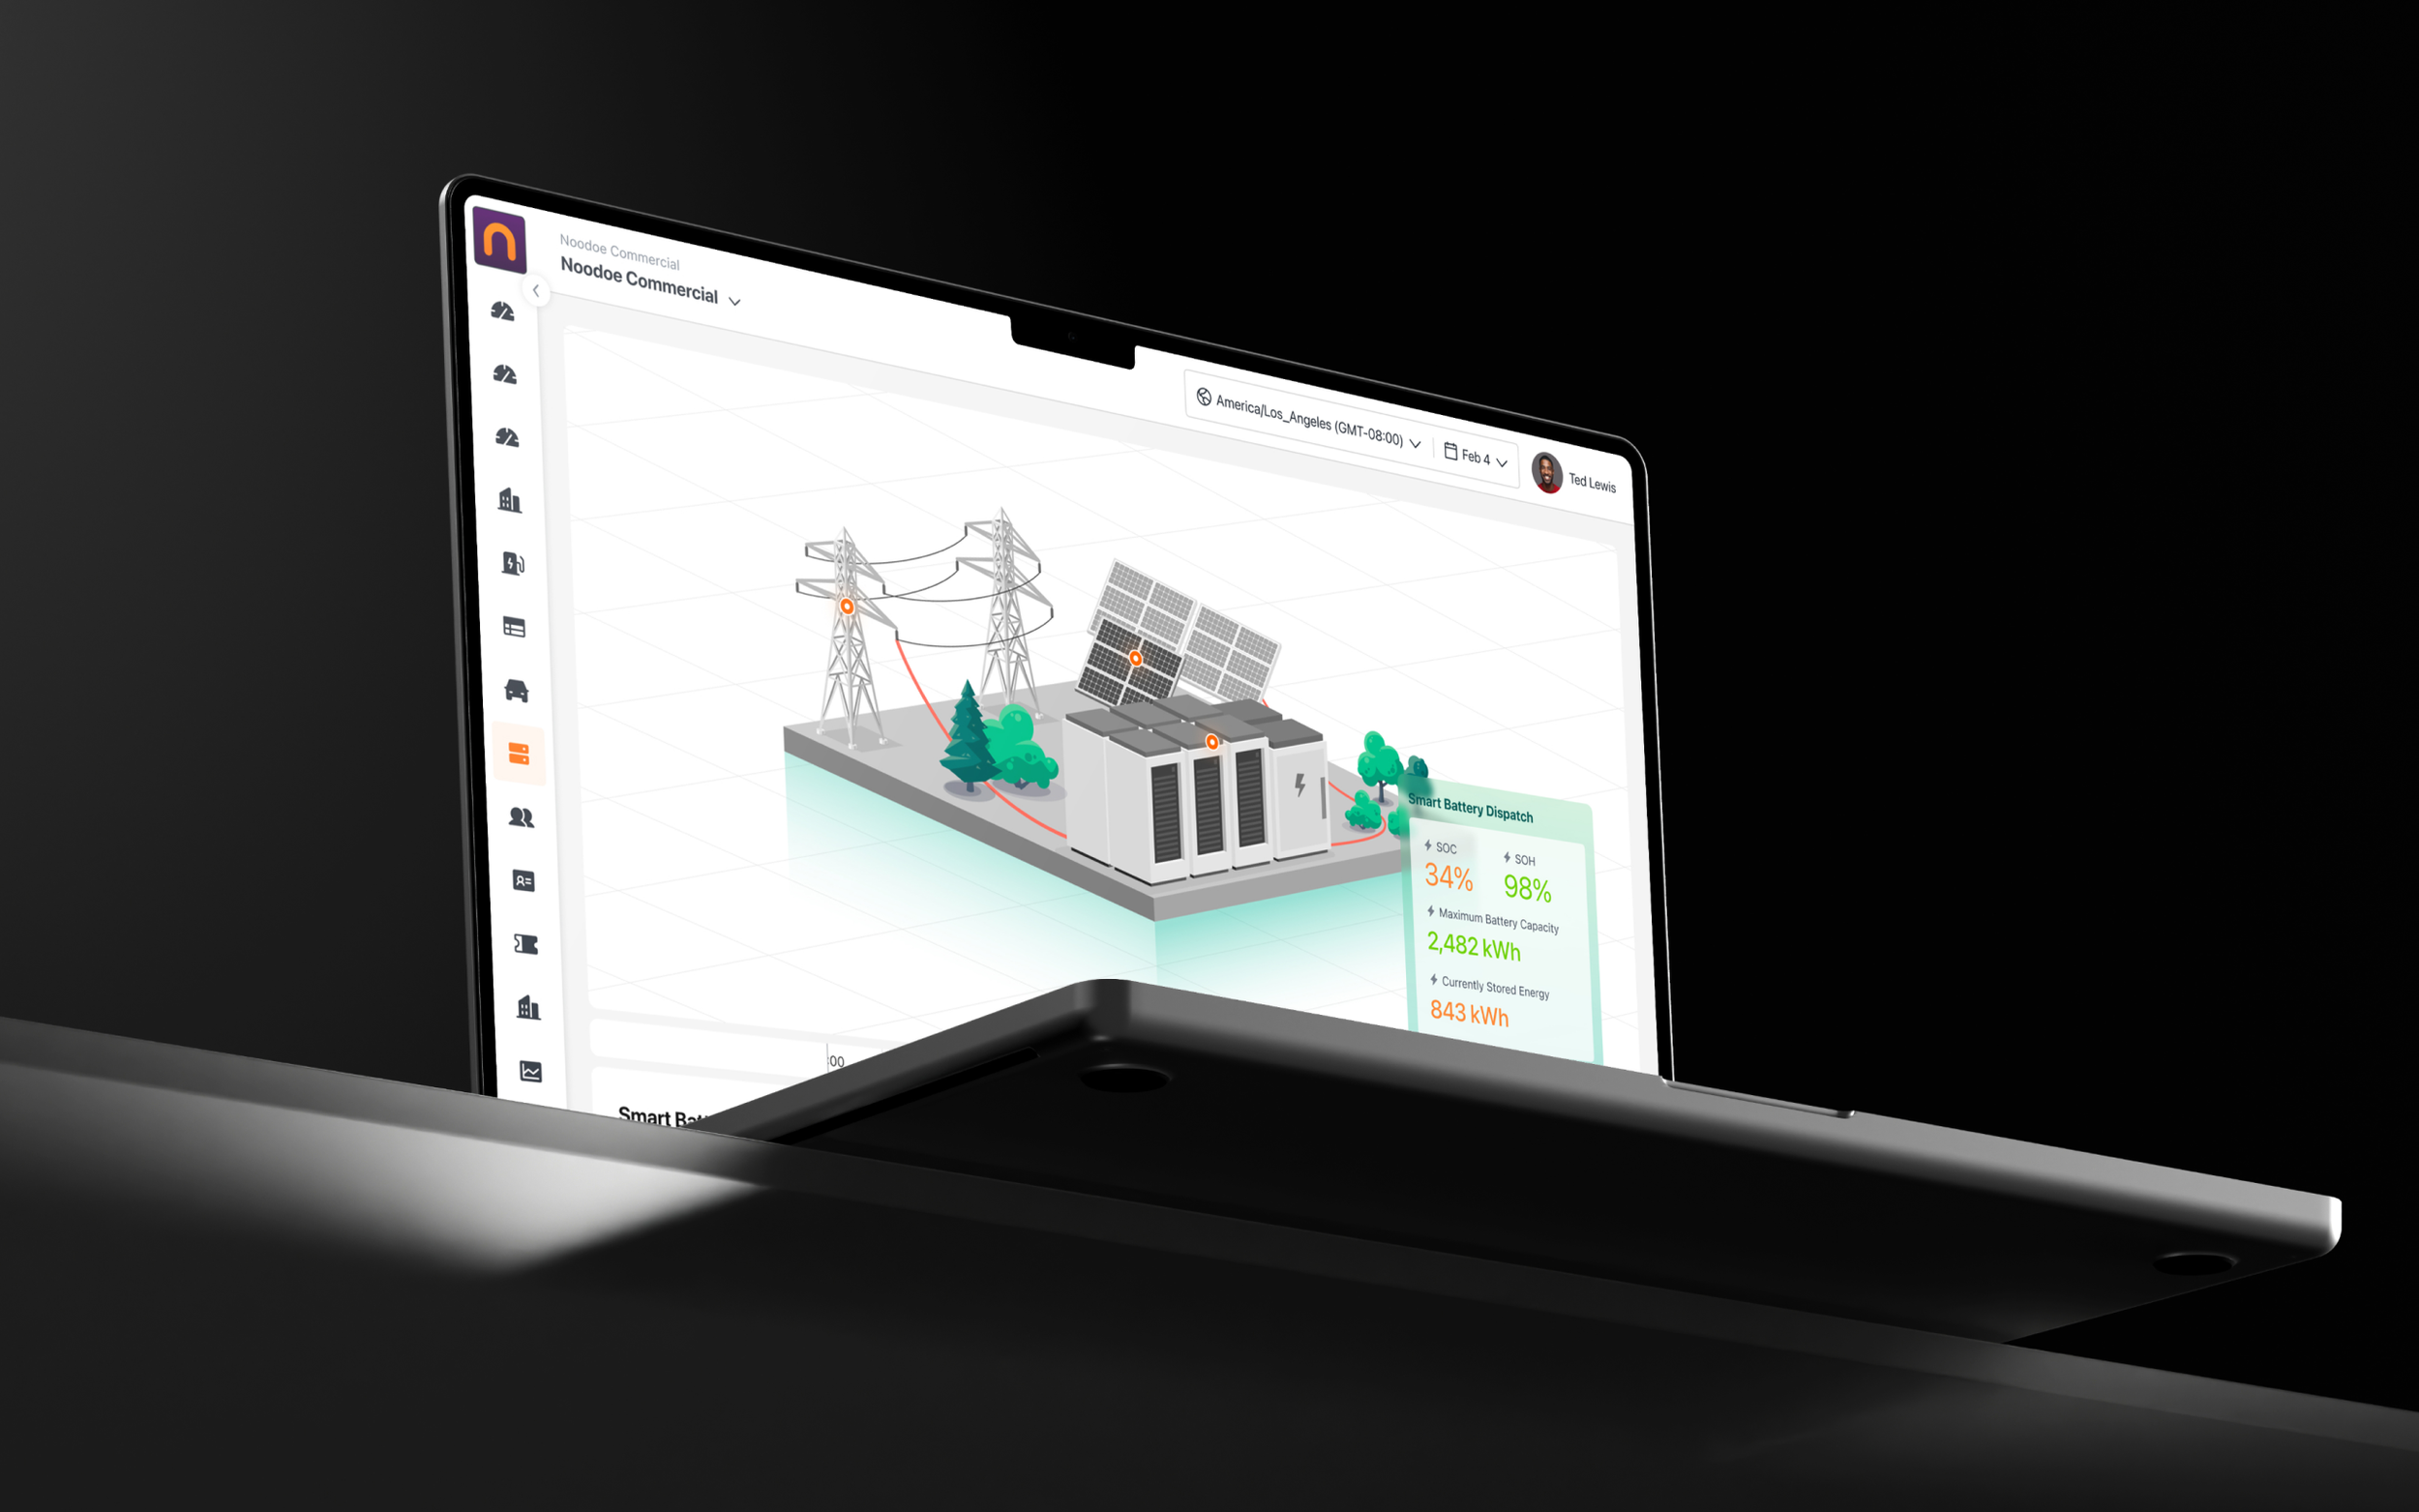
“We visualized the devices through graphical representations, enabling administrators to clearly see the number and types of hardware at each site. This also allows them to view individual device data with ease.”
From Innovation to Implementation
Evolving Global Energy Management with Noodoe EVOS
In the energy management sector, we’ve adopted a distinctive approach to device control—treating each device as an individual department within an organization, each contributing to operational profitability. This conceptual framework led to the development of a Gantt chart-inspired management interface. Through this intuitive visual timeline, administrators can dynamically add or remove data points to monitor, while AI-driven forecasting models project future trends. The result is a highly customizable, predictive management experience that transforms data into actionable insights.

Design Features
Intuitive Gantt Chart Design for Clear Overview
An intuitive Gantt chart interface clearly displays the operating sequences and statuses of all devices. This visual approach enables users to quickly grasp the overall system flow, enhancing monitoring and operational clarity.
AI-Powered Predictive Capabilities
By leveraging AI-driven prediction models, the system identifies usage trends and potential anomalies, while automatically adjusting charge/discharge ratios to adapt to future energy demands and strategic objectives.
Chart-Based Visualization of Historical Records and Trends
Historical records and trend shifts are visualized through Gantt-style charts, allowing administrators to easily detect anomalies and compare changes over time—enhancing data interpretation and decision-making.
Highly Customizable Hardware Integration
The platform supports flexible integration of various hardware components, enabling administrators to add or remove modules and configure charge/discharge priorities based on site-specific requirements—offering a truly tailored energy management solution.
